
Creative Jobs That Pay Well, Ranked by Openings to 2035.
Published
Producers and directors are the best-paid of the 11 creative and culinary jobs in this ranking, at a median of $90,360 a year in May 2025, but the openings are in kitchens. Of the 294,300 openings a year that the Bureau of Labor Statistics projects from 2025 to 2035 across the 11 audio, film, broadcast, music and culinary occupations, 243,800, or 82.8 percent, are for restaurant cooks and chefs.
The five best-paid occupations in this set together have fewer projected openings (22,900 a year) than chefs and head cooks alone (25,200). BLS figures cover everyone working in the job; they are not a forecast for any one person.
Key findings
From a Dream Career Connection analysis of BLS data for 11 audio, film, broadcast, music and culinary occupations. Quote any line with a link to this page.
- Restaurant cooks and chefs account for 243,800 of the 294,300 openings a year projected from 2025 to 2035 across the 11 occupations, or 82.8 percent.
- Restaurant cooks are the fastest-growing of the 11 occupations, with employment projected to rise 12.1 percent from 2025 to 2035, more than three times the 3.5 percent BLS projects for all US jobs.
- Producers and directors are the best-paid of the 11 occupations, at a median of $90,360 a year in May 2025, against $50,980 for all US jobs.
- The five best-paid of the 11 occupations (producers and directors, film and video editors, camera operators, music directors and composers, and sound engineering technicians) have 22,900 projected openings a year combined, fewer than the 25,200 for chefs and head cooks alone.
- Broadcast announcers and radio DJs face the steepest projected decline of the 11 occupations, down 7.6 percent from 2025 to 2035; BLS points to station consolidation and to stations that may run "without live DJs or with artificial intelligence (AI) DJs."
- Self-employment runs high in creative work: 35.5 percent of film and video editors and 47.8 percent of musicians and singers were self-employed in 2025, against 5.8 percent of all US workers, so payroll counts miss much of the work.
- The Los Angeles and New York metro areas together employ 36.5 percent of the country's payroll sound engineering technicians and 36.9 percent of its payroll film and video editors.
- Seven metro areas rank in the top 10 for job concentration in both Recording Connection's ranking for sound engineering technicians and Film Connection's ranking for film and video editors: Los Angeles, New York, San Francisco, Nashville, Las Vegas, Salt Lake City and San Jose.
Creative and culinary jobs ranked by openings, 2025 to 2035
Ranked by the openings BLS projects each year, on average, from 2025 to 2035. Payroll jobs and median pay are national figures for May 2025.
| Rank | Occupation | Payroll jobs, May 2025 | Median pay, May 2025 | Projected change, 2025 to 2035 | Openings a year |
|---|---|---|---|---|---|
| 1 | Restaurant cooks | 1,409,890 | $37,390 | +12.1% | 218,600 |
| 2 | Chefs and head cooks | 200,040 | $62,470 | +6.6% | 25,200 |
| 3 | Musicians and singers | 36,180 | Not published yearly ($47.80 an hour) | +0.3% | 17,400 |
| 4 | Producers and directors | 143,120 | $90,360 | +4.0% | 12,100 |
| 5 | Audio and video technicians | 70,230 | $58,100 | +3.9% | 6,600 |
| 6 | Music directors and composers | 12,540 | $73,710 | +1.2% | 4,200 |
| 7 | Film and video editors | 25,610 | $75,420 | +3.7% | 3,100 |
| 8 | Camera operators, television, video, and film | 21,550 | $74,990 | +1.3% | 2,500 |
| 9 | Broadcast announcers and radio DJs | 21,240 | $47,340 | -7.6% | 2,000 |
| 10 | Broadcast technicians | 21,110 | $59,570 | -3.1% | 1,600 |
| 11 | Sound engineering technicians | 13,080 | $73,130 | -3.1% | 1,000 |
Sources: payroll jobs and median pay from the BLS Occupational Employment and Wage Statistics, May 2025; projected change and openings from BLS Employment Projections, Table 1.2, 2025 to 2035. Each occupation links to its BLS Occupational Outlook Handbook profile. BLS publishes no yearly median for musicians and singers, only the hourly one.
For comparison, BLS projects all US jobs to grow 3.5 percent over the decade, and the median for all occupations was $50,980 in May 2025. A median is the middle of the range: half of the workers in the job earned more, half earned less.
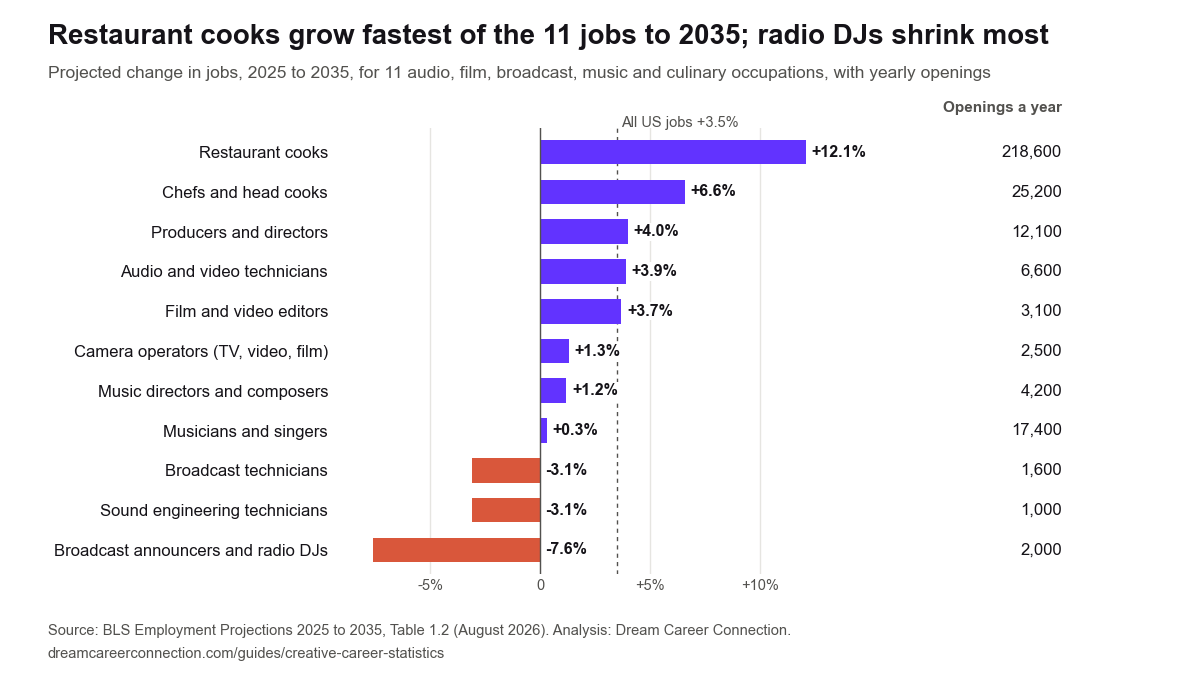
The same ranking as a chart, free to reuse with credit: projected change in jobs for all 11 occupations, 2025 to 2035 (PNG, 1200 by 675).
What creative jobs are in demand?
Five of the 11 are projected to grow faster than the 3.5 percent BLS projects for all jobs: restaurant cooks (12.1 percent), chefs and head cooks (6.6), producers and directors (4.0), audio and video technicians (3.9) and film and video editors (3.7). The Handbook gives a reason for each.
- Kitchens. "Population and income growth are expected to result in greater consumer demand for food at a variety of dining places," BLS writes of cooks. For chefs, it notes that dining places "hire experienced chefs to oversee food preparation."
- Video. "Demand for video advertising across platforms is projected to increase demand" for producers and directors, and "overall demand for content and an increase in special effects are expected to create jobs for film and video editors."
- Offices. Companies "are continuing to increase their audio and video budgets so they can use video conferencing to reduce travel costs," which supports audio and video technicians.
Growth is only part of the count. BLS defines openings as new jobs plus the jobs people leave when they retire or move to another occupation, and in all 11 occupations most openings come from people leaving, not from new jobs. That is why musicians and singers, a job BLS expects to show "little or no change," still have 17,400 openings a year, the third-most in this set.
CASA breaks down the kitchen numbers in its chef statistics. For the work itself, see what a line cook does.
Which creative jobs pay the most?
Producers and directors lead at $90,360. Four more cleared $73,000 in May 2025: film and video editors ($75,420), camera operators ($74,990), music directors and composers ($73,710) and sound engineering technicians ($73,130). Each sits well above the $50,980 median for all US jobs.
Two in this set sit below it. Restaurant cooks earned a median of $37,390. Broadcast announcers and radio DJs earned $47,340, which the Handbook shows by the hour as $22.76.
Inside one kitchen the gap is wide. Chefs and head cooks earned $25,080 more than restaurant cooks at the median, and BLS lists 5 years or more of related work experience as typical for the chef title.
Pay also varies by city. Of the 40 large metro areas we compared, San Francisco ($109,930) and New York ($104,590) had the highest medians for film and video editors. New York ($97,510) and San Francisco ($94,990) led for sound engineering technicians. Film Connection maps editing jobs and pay city by city in its best cities for film editing jobs.
Which creative jobs are shrinking, and is AI the reason?
Three of the 11 are projected to lose jobs from 2025 to 2035: broadcast announcers and radio DJs (down 7.6 percent), broadcast technicians (down 3.1) and sound engineering technicians (down 3.1).
BLS names AI in both cases. For technicians, "advances in technology, including artificial intelligence (AI), will allow fewer technicians to set up and operate broadcast, lighting, and sound systems." For radio, "continuing consolidation of radio and television stations is projected to limit employment growth," and "more radio stations may opt to run without live DJs or with artificial intelligence (AI) DJs."
Fewer jobs does not mean no openings. BLS still projects about 2,000 openings a year for broadcast announcers and radio DJs, 1,600 for broadcast technicians and 1,000 for sound engineering technicians. Those openings come from people who retire or change careers. Radio Connection tracks the audience side in its radio listening statistics. For the jobs themselves, see what a radio host does and what a board operator does.
Sound engineering technicians show the report's pattern most sharply: the second-smallest payroll count of the 11 (13,080), the fewest openings (about 1,000 a year) and a median of $73,130.
How many people work in creative jobs in the US?
It depends on who is counted. The May 2025 wage survey asks employers, so it counts payroll jobs: 25,610 film and video editors, 13,080 sound engineering technicians and 36,180 musicians and singers. BLS's projections also count the self-employed, and they put 2025 employment at 39,400 film and video editors, 15,000 sound engineering technicians and 170,400 musicians and singers.
Much of the gap is freelance work. BLS counts these shares of each job as self-employed in 2025:
| Occupation | Self-employed, 2025 |
|---|---|
| Musicians and singers | 47.8% |
| Film and video editors | 35.5% |
| Camera operators, television, video, and film | 34.7% |
| Music directors and composers | 24.7% |
| Producers and directors | 20.4% |
| Sound engineering technicians | 11.8% |
| Broadcast technicians | 11.3% |
| Audio and video technicians | 10.0% |
| Chefs and head cooks | 6.8% |
| Broadcast announcers and radio DJs | 2.3% |
| All US occupations | 5.8% |
Source: BLS Employment Projections, Table 1.2. BLS publishes no self-employed share for restaurant cooks.
Across the whole BLS group of arts and media occupations, from designers to athletes, 26.6 percent are self-employed. Anyone quoting payroll figures for film or music should carry that caveat: the count leaves out a large part of the work.
What city has the most audio and film jobs?
Los Angeles, by a wide margin. The metro area had 2,820 payroll sound engineering technicians and 6,010 film and video editors in May 2025: about 22 percent and 23 percent of the national totals. New York was second for both, and the two metros together held 36.5 percent of payroll sound engineering technicians and 36.9 percent of film and video editors.
Concentration tells a different story from size. Recording Connection ranks 28 metro areas by how concentrated sound engineering technicians are against the national average, and Film Connection ranks 35 by the same measure for film and video editors. Seven metros make the top 10 of both rankings:
| Metro area | Sound engineering technicians | Concentration | Film and video editors | Concentration |
|---|---|---|---|---|
| Los Angeles | 2,820 | 5.34 | 6,010 | 5.82 |
| New York | 1,960 | 2.45 | 3,430 | 2.20 |
| San Francisco | 460 | 2.32 | 740 | 1.89 |
| Nashville | 320 | 3.50 | 300 | 1.64 |
| Las Vegas | 140 | 1.44 | 280 | 1.49 |
| Salt Lake City | 160 | 2.28 | 220 | 1.64 |
| San Jose | 140 | 1.50 | 240 | 1.30 |
Source: BLS Occupational Employment and Wage Statistics, May 2025, metro area estimates, payroll jobs. Sorted by combined payroll jobs in the two occupations. A concentration of 2.0 means the job's share of the metro's employment is twice its national share.
Three of these stand out. Nashville has the second-highest concentration of sound engineering technicians, 3.5 times the national share, behind only Los Angeles. Salt Lake City ranks sixth for that job, yet its sound engineering technicians had a median of $36,400, the lowest of any metro in Recording Connection's ranking. Las Vegas runs above the national share in both jobs, and its sound engineering technicians earned a median of $81,840, above the national $73,130.
Recording Connection ranks the metros for audio work in its best cities for audio engineering jobs. Dream Career Connection's partner studios and kitchens are on the studios map.
What the numbers mean if you are choosing a field
- Kitchens have the openings; the chef title takes years. Restaurant cooks have the most openings and the lowest median in this set, and the higher chef median comes after years of related work. See what an executive chef does.
- Audio and film pay above the national median, with few payroll seats. Film and video editors, camera operators and sound engineering technicians each have 3,100 or fewer openings a year, and about a third of editors and camera operators work for themselves.
- Broadcast is shrinking, not closed. Radio announcers, DJs and broadcast technicians still have about 3,600 openings a year between them.
Dream Career Connection pairs people one on one with working professionals inside real studios, sets, stations and kitchens, through the four brands linked above. The programs page covers the four fields, the mentors page lists who takes mentees, and a twenty-minute interview covers your craft and your city. If you already work full time, the career change at 30 guide compares the routes for people who cannot stop earning.
How we did this
- Pay and payroll jobs. BLS Occupational Employment and Wage Statistics (OEWS), May 2025, national and metro area estimates, pulled from the BLS public data service on October 19, 2026. OEWS surveys employers, so it counts payroll jobs only; the self-employed and most freelancers are left out. Where BLS did not publish a figure, because too few employers reported it or it failed a reliability rule, we left it out rather than estimate it. BLS published no May 2025 count of film and video editors for the Atlanta metro area, for example.
- Growth and openings. BLS Employment Projections 2025 to 2035, Table 1.2, last modified August 27, 2026. Projections count all jobs, including the self-employed. BLS defines openings as "the sum of net occupational employment change and occupational separations," meaning new jobs plus the jobs left by people who exit the occupation. We use the table's one-decimal percentages. The Handbook rounds them to whole numbers, so it shows film and video editors at 4 percent where the table shows 3.7.
- Concentration. BLS calls it the location quotient: a job's share of a metro area's employment divided by its national share. 1.0 matches the national average; 2.0 is twice it. For the city view we used the two brand rankings built from the same data: Recording Connection's 28 metro areas for sound engineering technicians and Film Connection's 35 for film and video editors, each covering the metros where that brand has a city page and BLS published the figure. We kept the metros in the top 10 of both.
- Margins. Metro figures are survey estimates, and small counts carry wide margins. BLS puts the relative standard error on the Los Angeles count of sound engineering technicians at 41.6 percent, so read metro counts as estimates.
- The 11 occupations. They are the BLS occupations closest to the four fields Dream Career Connection works in: music and audio, film and video, radio and broadcast, and professional kitchens.
Cite this data
You may use these figures and the chart in your own reporting, with credit to Dream Career Connection and a link to this page: https://dreamcareerconnection.com/guides/creative-career-statistics.
Download the data (CSV): the 11 occupations in the ranking and the all-jobs comparison, with the source on every row.
Suggested citation: Dream Career Connection, "Creative Jobs That Pay Well, Ranked by Openings to 2035," October 28, 2026, analysis of BLS Employment Projections 2025 to 2035 and Occupational Employment and Wage Statistics, May 2025, https://dreamcareerconnection.com/guides/creative-career-statistics
QuestionsPeople ask.
What creative jobs are in demand?
Restaurant cooks lead: the Bureau of Labor Statistics projects their employment to grow 12.1 percent from 2025 to 2035, with 218,600 openings a year. Chefs and head cooks (6.6 percent), producers and directors (4.0), audio and video technicians (3.9) and film and video editors (3.7) are also projected to grow faster than the 3.5 percent for all US jobs.
Which creative jobs pay the most?
Producers and directors, at a median of $90,360 a year in May 2025, per BLS. Film and video editors ($75,420), camera operators ($74,990), music directors and composers ($73,710) and sound engineering technicians ($73,130) follow. The median for all US jobs was $50,980.
How many sound engineers are there in the US?
BLS counted 13,080 sound engineering technicians on US payrolls in May 2025. Its projections, which also count the self-employed, put the total at 15,000 jobs in 2025, falling to 14,600 by 2035.
What city has the most film and audio jobs?
Los Angeles. The metro area had 6,010 film and video editors and 2,820 sound engineering technicians on payrolls in May 2025: about 23 percent of the nation's payroll editors and 22 percent of its sound engineering technicians, according to BLS.
Will AI replace sound engineers and radio DJs?
BLS projects fewer of both jobs, not none. It expects sound engineering technician jobs to fall 3.1 percent and broadcast announcer and radio DJ jobs 7.6 percent from 2025 to 2035, names AI among the reasons, and still projects about 1,000 and 2,000 openings a year as people retire or change careers.
Are most creative workers self-employed?
In film and music, a large share are. BLS counts 35.5 percent of film and video editors, 34.7 percent of camera operators and 47.8 percent of musicians and singers as self-employed in 2025, against 5.8 percent of all US workers. Payroll counts, such as the May 2025 wage survey, leave them out.
Tell us the craft and the city.
Recording Connection, Film Connection, Radio Connection, and CASA: The Chef Apprentice Studio of the Arts each pair mentees one-on-one with working professionals. In a twenty-minute interview we listen for the craft and the city, then route you to the closest working pro.